
p style=”text-align: center;”>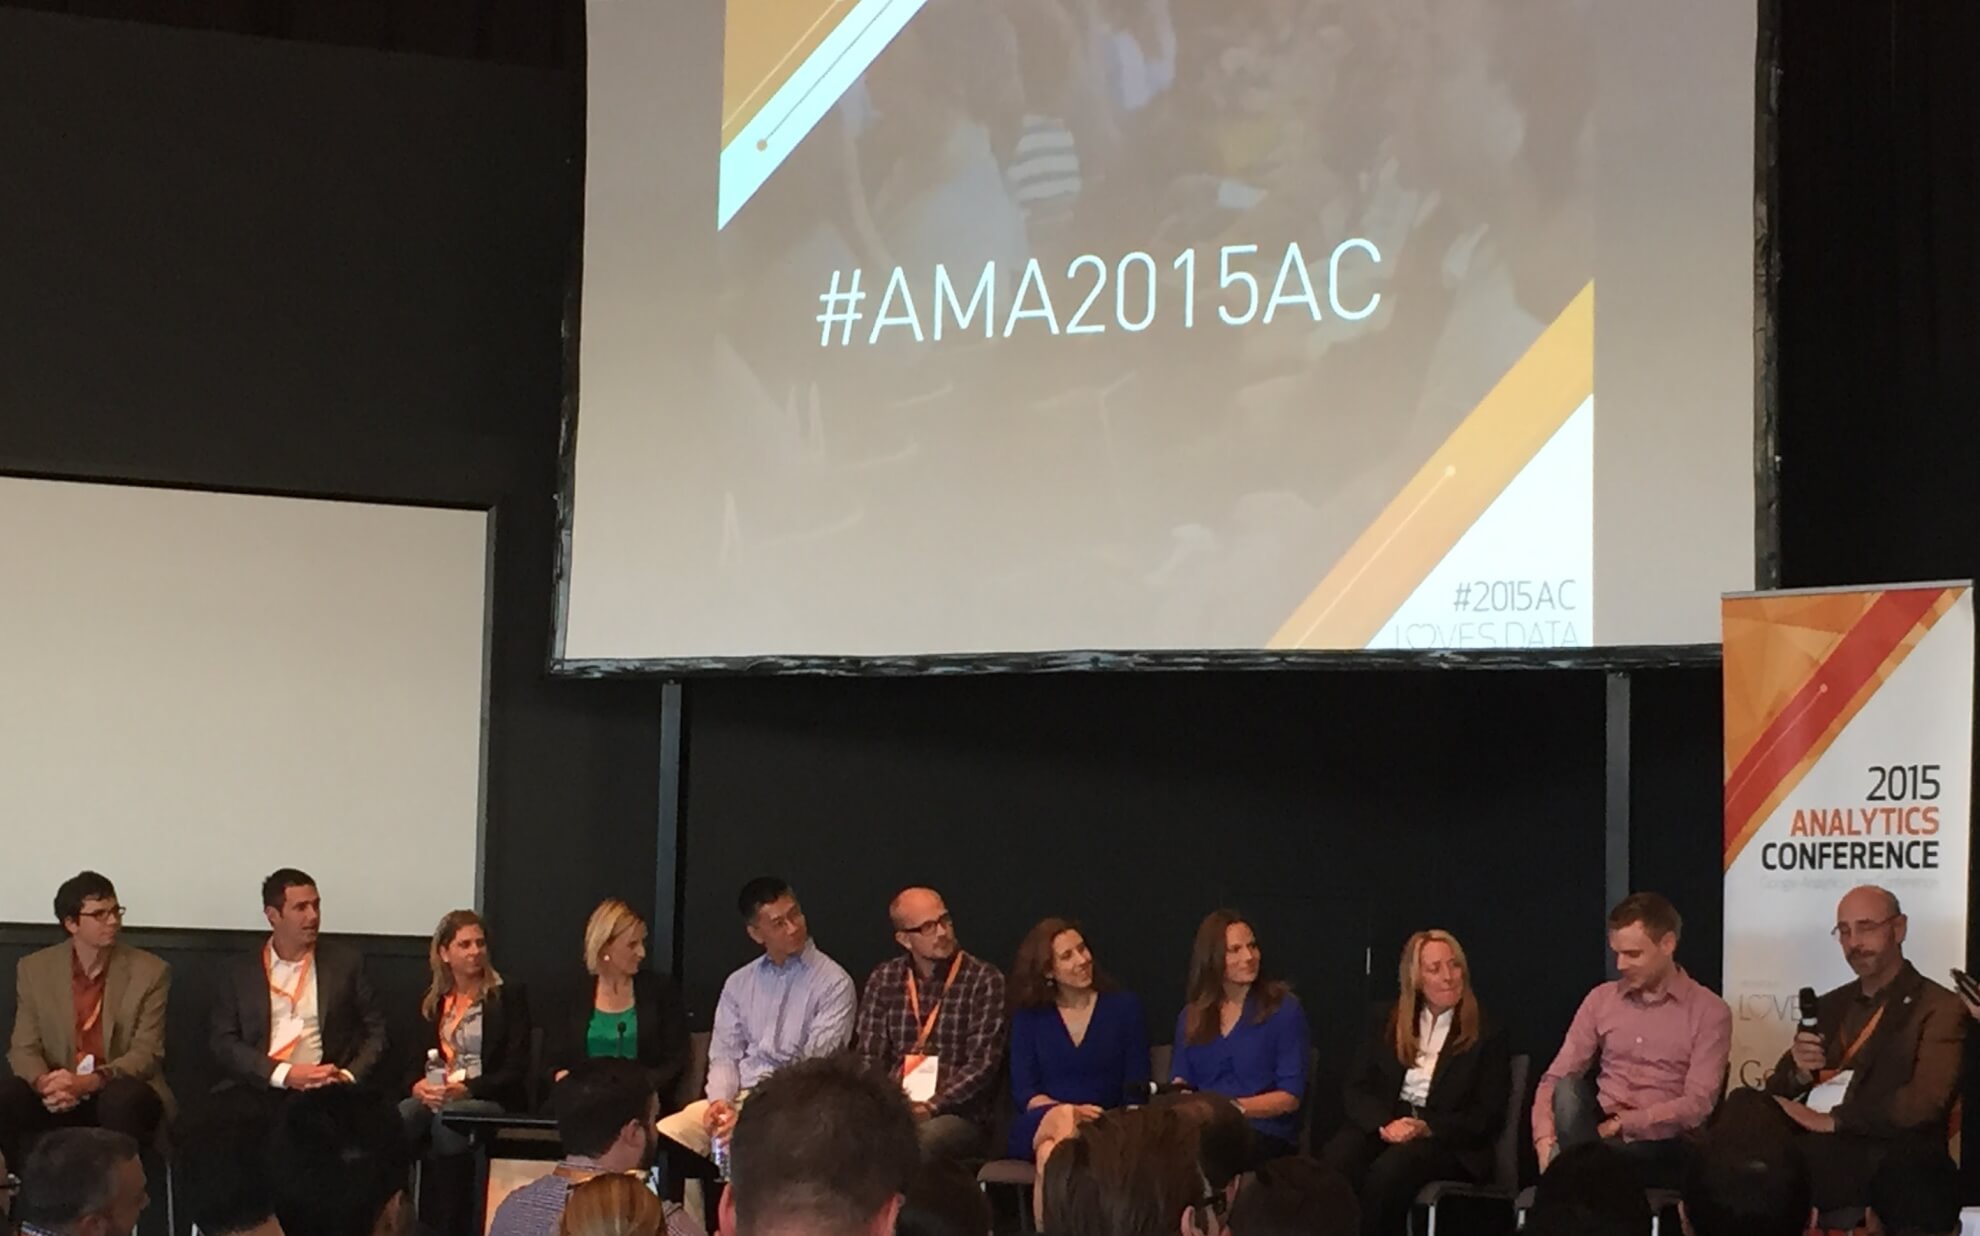
Last month, I attended the 2015 Analytics conference in Sydney presented by Loves Data with Google and gathering under one roof some of the top leaders in the Analytics industry.
There were a lot of great insights on the fundamentals of data analytics and making it more powerful, while staying easy to use. I’m not going to detail each session – we could write a book about each – but here are some key things we should always keep in mind:
1- Data Analytics Is A Science
Therefore it should be approached as such, meaning with a scientific methodology. In that sense, I like the DRIVE Optimisation framework presented by Carey Wilkins, President of Evolytics:
Discover: Understanding goals & measurement needs across the business
Reveal: Documenting measurement requirements & prioritising KPIs
Implement: Documenting implementation plan & generating analytics code
Validate: Assuring quality with data collection & platform configuration
Examine: Designing reports, data visualisation/storytelling & training reporting audiences
Optimise: Translating analysis insights into action
2- Don’t Take Data For Granted
Always plan, scope, test implementation and monitor results. Even for a standard Google Analytics (GA) implementation, things can go wrong. Many metrics in GA are based on session, so it’s really important to know how your session is calculated. Not to mention the bounce rate or the users calculation that are even trickier. This is the reason why you should customise GA with custom dimensions and metrics that make sense for your business.
3- Customise & Segment
From the point above, data collection becomes powerful only if the data you collect are meaningful to your business and can lead to changes. GA allows you to create your own dimensions and metrics so don’t ignore them.
Secondly as Simo Ahava would say “averages are $h!t” – meaning that you will learn very little by looking at average and total lines. Looking at overall data assumes that all users are the same, have the same needs, are at the same making decision stage, which of course is wrong.
4- Know Your KPI & Target
Too often we start an analytics project without precisely knowing what we (the client and the agency) will be judged on. Analysts and marketers need to have a discussion together to define a clear measurable KPI including a target, in % or volume and in time.
To facilitate this potentially painful process, Tim Wilson from Analytics Demystified recommends asking yourself these two magic questions:
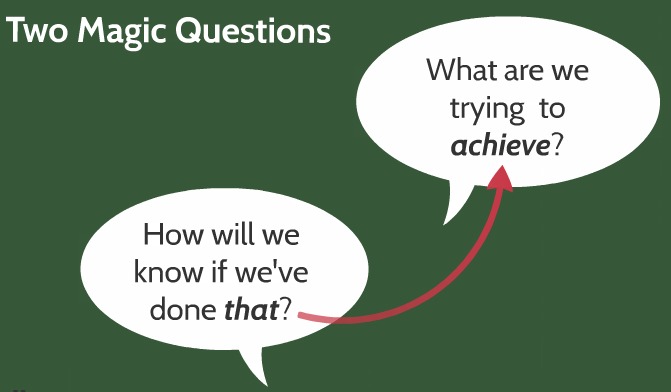
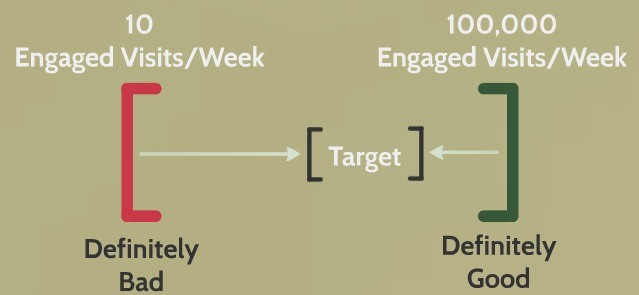
Then analysts and marketers should quantify the KPI target by applying the “bracketing” approach, i.e. start with a loose bracket then aim for the average:
This is a good opportunity for all to sit back and think of what the true business’ objectives are.
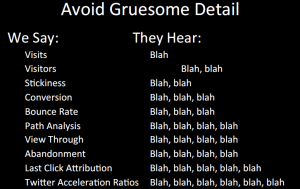
5- Talk The Same Language
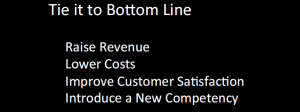
Too often we get drown by loads of metrics and dimensions. We get excited by the amount of data but they are useless if not actionable and/or not relevant to the business’ objectives. These two slides from Jim Sterne emphasises on this point:
6- Communicate Analytics Insights Loud & Clear
Doing great data analysis doesn’t help the business if you don’t efficiently communicate your results to the stakeholders and decision makers. And to do so, you must keep their attention throughout your presentations. Your presentations should be tailored to your audience (top level/ middle management).
Lea Pica provides some great tips on how to create enthralling presentations.
7- Make Some Assumptions, Test, Learn & Start Again
Analytics is not just about insights – it’s also about making hypothesis and validating them with data.
Below is what I would call the virtuous circle of analytics:
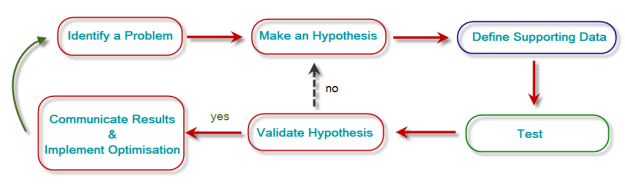
1.Identify the problem
The most exciting phrase that heralds new discoveries, is not Eureka! (I found it), but ‘That’s funny…’
– Isaac Asimov.
As Jim Sterne explained, the low hanging fruit of analysis lie in:
– Anomalies
– Errors & omissions
– Complaints
– Spikes & through
– Oddities.
2. Make a hypothesis
Draw one or more hypothesis, from best practices to user feedback or from your own experience.
Use this template given by Tim Wilson to create an assumption:
I believe…
…visitors miss required fields in the checkout process and have to submit multiple times before successfully completing the process.
If I am right, I will…
…increase the prominence of the “required fields”.
3. Define supporting data
How will you know your hypothesis is validated? Make sure you have the supporting metrics and dimensions to validate your tests. If not, scope your requirements, implement the tracking, test and gather enough data for compare them against your period of test.
4. Test
Ideally with an A/B testing tool such as Optimizely. Make sure to build your custom analytics reports beforehand to keep track of test results so you can stop your experiment quickly if things go bad.
5. Validate Hypothesis
Did your test improve your KPI?
No? Then make a second hypothesis.
Yes? Then congratulate yourself and communicate your win to the business. And of course implement your winning variation.
6. Start again
Repeat the process by moving on to the next most important point to optimise or the next anomaly you have spotted.
8- Analytics Doesn’t Tell Us All
Data is everywhere but you don’t get the full picture with quantitative data only. It would be like assuming a cake is good just based on a recipe, without actually tasting this cake.
Qualitative data are as important as quantitative data and they often provide insights that you would never have found of with GA only. So, do ask your users about their experience on your site through surveys, user testing, interviews, etc. Many tools like UserTesting or Qualaroo can help you find the hidden gems and when you know that you only need 5 users to detect 85% of issues, that would be too bad not to do it, right?

- This cake looks good but is it?

Bonus
In bonus some inspiring quotes from the Analytics Conference speakers:
“Your slides are for your audience, not you.”
– Lea Pica on Get Their Attention
“Analytics are worthless without goals.”
“You become necessary when you see things that others cannot.”
“You know the truth / your clients know the reality”.
– Jim Sterne on Becoming Indispensable:
“An effective analysis is nothing more than testing an hypothesis.”
– Tim Wilson on Finding Analytics Insights
“Browsers have sessions, people have moments.”
– Carey Wilkins on Applying Analytics Framework to Your Organisation
Some Resources
Demystified blog
LeaPica.com
Simo Ahava’s blog
eMetrics Summit blog