20 YEARS+
Over 20 years leading in digital strategy, analytics, paid media, SEO and CRO.First Digital delivers results that redefine industry standards.
PAID MEDIA
Supercharge Your E-Commerce Reach. We create targeted PPC campaigns across Google Ads, Bing, and Meta fuel your growth with increased traffic, higher conversion rates & return on ad spend.
ANALYTICS
Unlock Insights for Smart Growth. Utilise cutting-edge analytics to uncover deep insights that drive smarter business decisions, optimising your marketing spend for the best returns.
SEO
Amplify Visibility and Engagement. Advanced SEO techniques boost your site’s visibility, attract more traffic, and connect you with ideal customers to enhance your market presence.
CRO
Optimize for Impact.
Our CRO strategies refine your website's
user experience to increase conversion rates, turning visitors into
loyal customers and maximizing revenue.
Digital Leaders
Forward-thinking at its core, our approach integrates advanced AI and the latest technologies to secure real results for our clients. We’re dedicated to pushing the boundaries of what’s possible in digital, ensuring you stay ahead in a rapidly evolving landscape.
We love what we do
Digital Specialists
We’re a team of specialists, focused on helping online businesses to grow by enhancing the online customer experience and by gaining deep customer insight.
We do this through strategic analysis, personalisation, ongoing testing, and through leveraging ‘best of breed’ technology partners.
We are client focussed
Digital Partner
Work with FIRST, where we take the time to understand every aspect of your business. Our focused approach ensures we deliver tailored solutions that drive significant outcomes, perfectly aligning with your business goals.
What We’re Made Of: Data, Digital & a Lot of Coffee.
Caffeine Dependency (Our ideas run on espresso.)0
Celebrating Client Wins (Your success = our party.)0
Meeting Deadlines (Powered by caffeine and sheer determination.)0
Building Long-Term Partnerships (We’re in it for the long haul—snacks included.)0
Pushing Boundaries (We don’t follow trends; we create them.)0
Turning Data into Strategy (Gut feelings are for lunch decisions.)0
``Giving Up`` (Only because we never actually do.)0
Marketing Strategy
Driving Growth with Strategy - We create and execute clear, effective marketing strategies that directly align with your business goals to enhance growth and market presence.
Search Engine Optimisation (SEO)
Boost Your Search Rankings - Improve your visibility online with our SEO services that elevate your search engine rankings and bring more targeted traffic to your site.
User Experience (UX)
Designing Engaging Experiences - We craft engaging and intuitive user experiences that keep your audience coming back, enhancing user satisfaction and loyalty.
Analytics & Reporting
Data-Driven Insights - Our analytics services equip you with actionable insights, helping you make informed decisions to steer your business forward.
Conversion Rate Optimisation
Enhancing Your Website's Performance - We focus on optimising your website to convert more visitors into customers, using strategic testing and adjustments.
Pay-Per-Click (PPC) Advertising
Effective PPC Campaigns - Attract quality traffic quickly with our targeted PPC campaigns, designed to deliver immediate results and maximize your advertising spend.
Kennards Self Storage Website
In UX Design / Website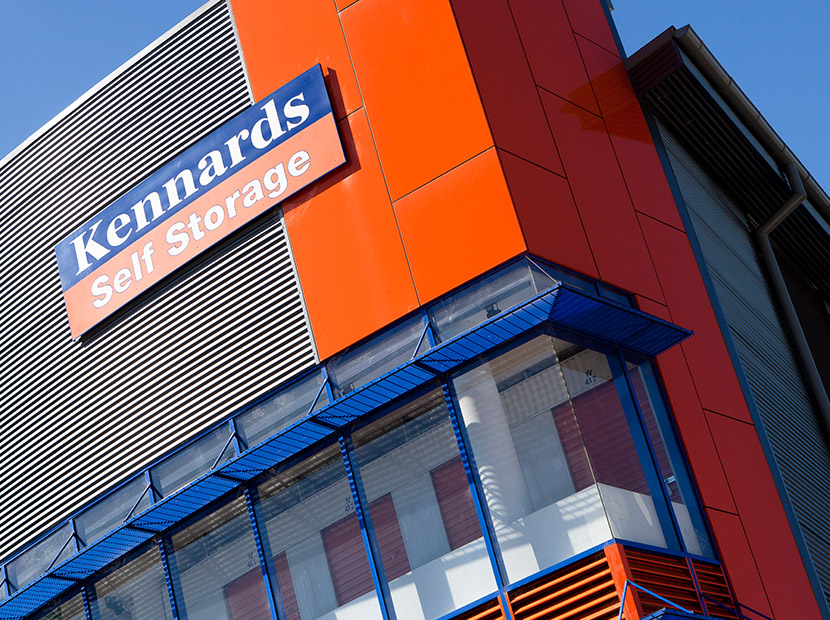
Synchronised Technology Shopify Websites
In Website
Dymocks Paid Shopping
In Paid Search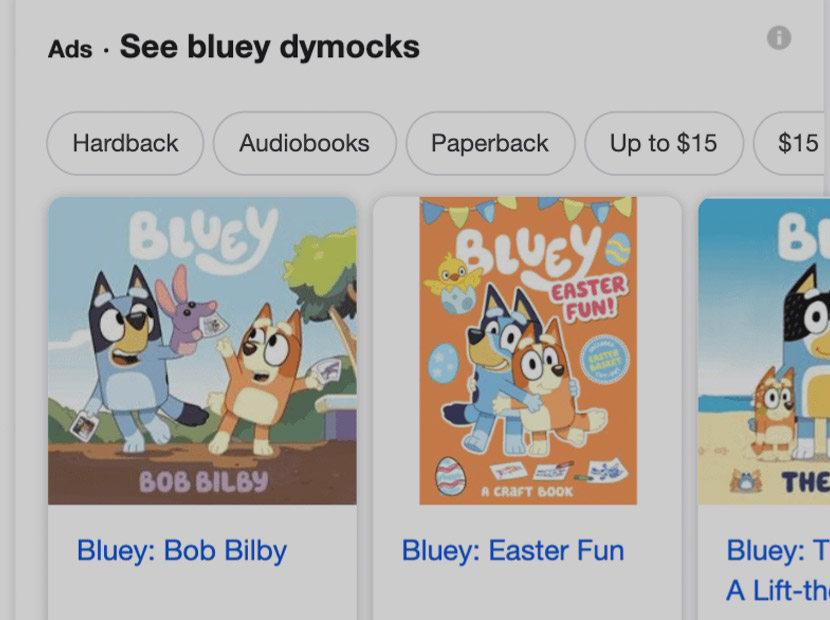
Takashimia Brand and Prototype
In Branding / Prototype
Unity4 Website
In Website
Amber Hospitality Website
In Website
MyBond Explainer Videos
In Animation / UX Design
Ramsay Centre Website
In UX Design / Website
Dymocks Website
In UX Design / Website
Mix & Match CRO
In CRO / UX Design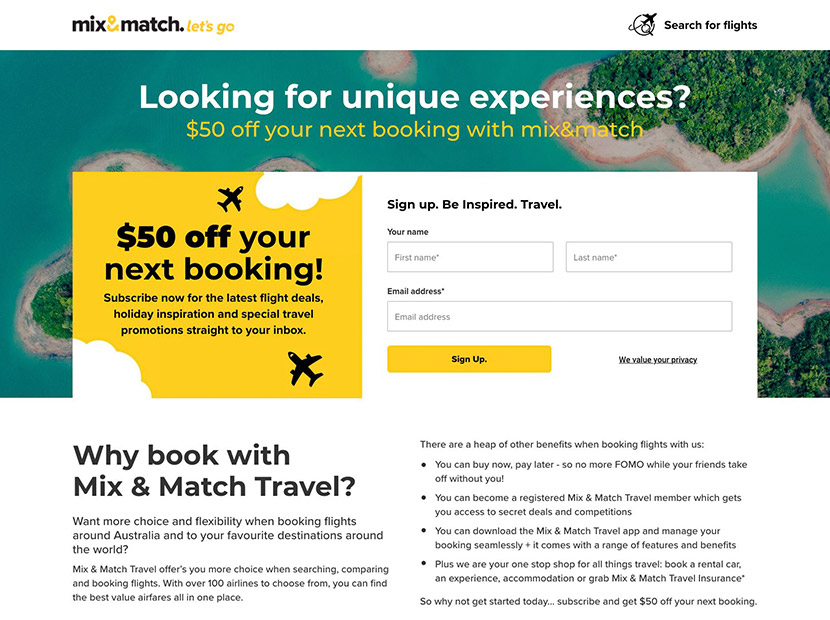
Kmart Gift Finder
In Prototype / UX Design
OneChoice Insurance Website
In Branding / UX Design / Website
We’re a team of digital experts obsessed with driving your online success. From elevating customer experiences to unlocking powerful insights, we continuously refine our strategies, personalise interactions, and collaborate with top tech providers. Our mission? To keep you ahead of the game with smart, results-driven solutions that make an impact.
Contact Us Today
For new business inquiries or to get in touch with our team just give us a call or drop us an email.
Average years at FIRST
We love what we do and we love working on it together. That's why we hang around to keep doing what we love.
Awards Won
Winning awards is not our goal, we just want to do great work for our clients that makes a meaningful result to their business.
Satisfied Clients
We measure our success by the satisfaction of our clients. Our dedication to exceeding expectations means our clients not only stay, they become our biggest advocates.
Projects Finished
Every project is a chance to innovate and excel. We pride ourselves on completing projects that not only meet but surpass client expectations, enhancing their business every step of the way.
