

This morning (U.S time) Google announced that new Google Analytics Benchmarking Reports are now available. According to Google, “benchmarking leverages the footprint of Google Analytics and can help you set meaningful targets, spot trends occurring across industries and answer a whole array of questions: Which channels should you be investing more in? How does your mobile engagement compare to your peers? How unique is your audience?”
Find out how these reports can help you gain insights and competitive intelligence.
Uncover Powerful Insights with the New Google Analytics Benchmarking Reports
These new benchmarking reports allow you to compare your website performance and results against the averages of similar websites for a variety of dimensions and metrics. It allows you to see trends happening across industries and to gain access to insights into how your site is performing relative to your peers and competitors.
For example you can filter by the following dimensions:
- Channel grouping (Direct, Organic, Paid, Referral, Email, Social, Display and Other)
- Location (Country)
- Device category (Desktop, Mobile and Tablet)
You can compare the following metrics:
- Sessions
- % New Sessions
- New Sessions
- Pages / Session
- Average Session Duration
- Bounce Rate
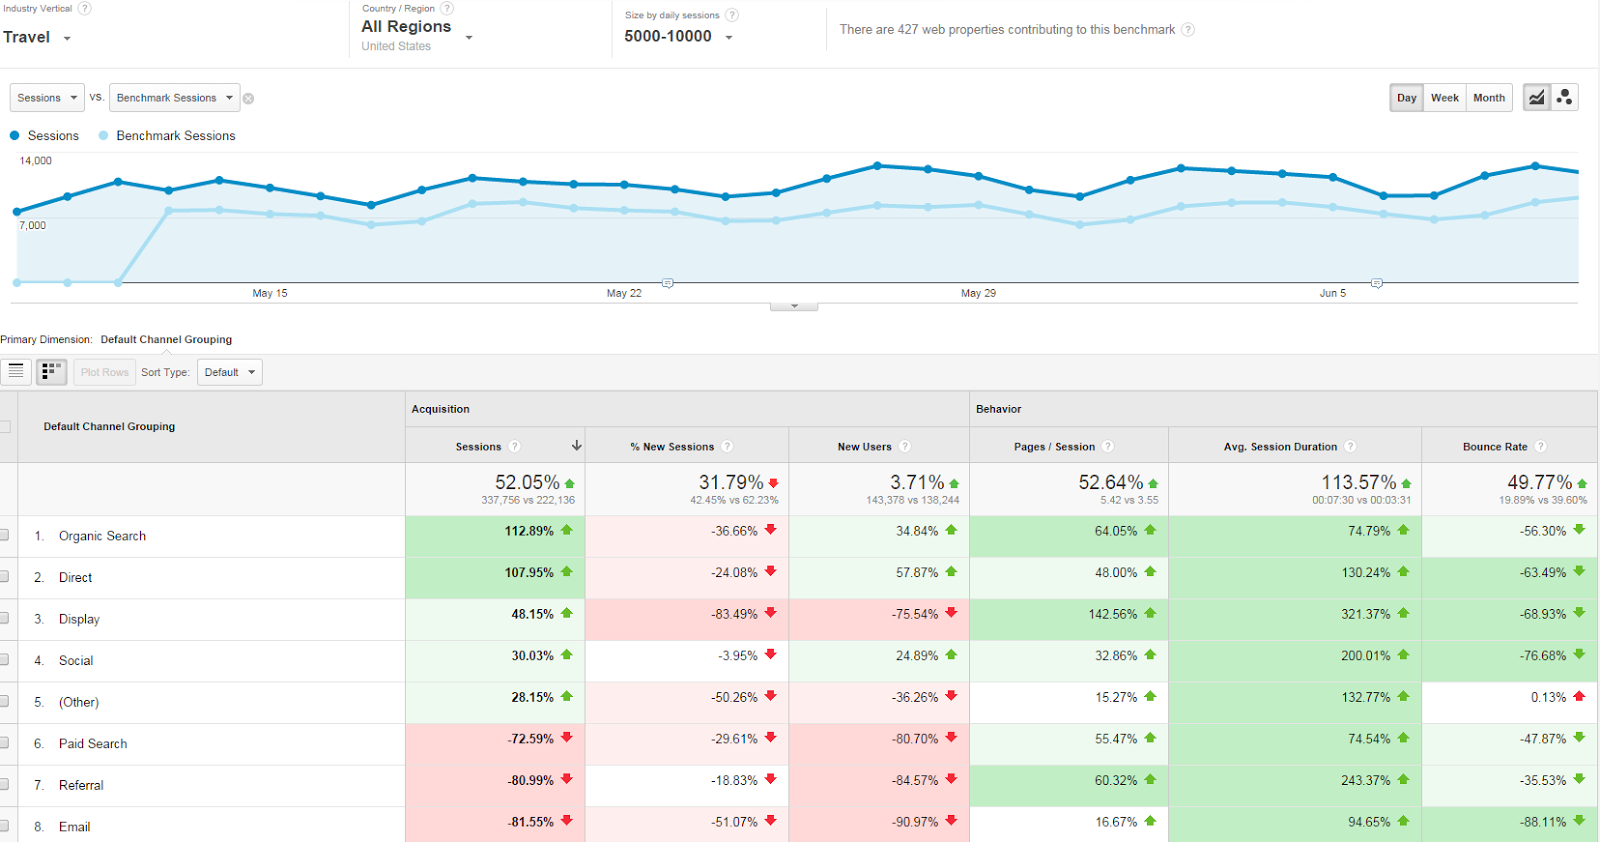
In the benchmarking reports, you can see how various metrics stack up against other sites in your industry. They even use colour coding to show at glance whether your business is above or below the industry average. For more accurate comparisons, you can choose from 1,600 industry categories, 1,250 markets and 7 size buckets. And for more transparency, Google stated that a heat map feature will be available to easily see areas which are working and areas which need improvement.
Real-life success story – How Twiddy finds a new email marketing opportunity
Vacation rental company Twiddy.com claimed that the benchmarking reports helped them identify opportunities for growth by identifying the factors that impacted conversion rates the most such as: price range, location, rental type and even the vacation week.
According to Twiddy CMO, Ross Twiddy, the results from the analysis led to a 48% average open rate and 40% click through rate.
Get Started with Benchmarking Reports
You will find these reports in the ‘Audience’ section of the reporting interface in the left sidebar of your Analytics dashboard.
If you cannot see these reports, you will need to follow these instructions. Only if you choose to share your data anonymously with others will you be able to see the benchmarking reports.
NZ Google Analytics Benchmarking Reports data
Let’s take a look at New Zealand Google Analytics benchmarking reports data.
In New Zealand, for shopping sites averaging 1,000 to 5,000 sessions per day, Google is currently collecting data from 125 properties. The below data is from these sites for August 2014:
- Average Sessions per Month: 62,000
- % New Sessions: 45%
- Average Pages per Session: 6.14
- Average Session Duration: 4:08
- Bounce Rate: 35%
And here is how the various traffic sources contribute to total sessions:
- Organic Search: 29%
- Direct: 18%
- Email: 18%
- Paid Search: 11%
- Other: 9%
- Referral: 7%
- Display: 4%
- Social: 4%
An observation from this limited set of data – Organic Search, Email and Direct referral sources are the biggest drivers of website visitors for NZ shopping sites. Display and Social activity on average do not drive a significant number of website visitor sessions.
We have found a few discrepancies in the data that we will observe further –
1) Not all data correlates exactly with these Google Analytics benchmarking reports. For example we have a client for which they were showing 10% the average number of sessions being driven by paid search, where we know in fact they are higher than the average
2) The sum of the channels does not equate to the sessions noted in the top line. Just something to be aware of.
3) For smaller regions (such as NZ) data will not show for many subcategories unless there are enough contributing properties to protect the privacy of those websites.
Perhaps not perfect, but the new Google Analytics benchmarking reports provides reasonable benchmarking data that may be difficult (or expensive) to get in other ways.
Take some time and benchmark your business – if you are way ahead of the average, evaluate success and ROI and if well, keep doing more of it. If you are lagging behind average it gives a good indication of where you need to be investing.
Do you want to get started on prioritizing improvement opportunities, setting achievable business goals and maintaining competitive advantage? Send us a message or give us a call at +64 9 9201740.